Gradle Technologies is now Develocity — read the announcement

Build Caching Optimizer

Stop paying for work that didn't need to run.

The Build Caching Optimizer's run report — 3 issues found and fixed, warm rebuild 1m10s to 12.4s, cache hit rate 63% to 100% — with a before/after table.

Feature overview

Build Caching Optimizer

Build Caching Optimizer is the fast-dimension agent of Develocity Agents — it wins back the build time avoidable cache misses are costing you. A correctly configured task still misses the cache when a volatile input, an absolute path, or an overlapping output slips in, and finding which miss matters and why takes scarce build-engineering expertise. The agent finds the most impactful avoidable misses from Build Scan data and an encoded Gradle and Maven playbook, root-causes each against the real build inputs, applies a minimum-change fix, re-validates it against a fresh build, and opens a pull request — directing the AI agents you already run, such as Claude and Codex — then quantifies the work it removed. Every finding cites the Build Scans behind it. GA for Gradle and Maven with Develocity 2026.2.

Turn a multi-day cache investigation into one autonomous run

  • Identify — only Develocity data finds which avoidable cache misses across your projects cost the most, so each run starts where the avoidable work actually is.
  • Fix — the agent root-causes each miss, applies the minimum change that resolves it, and opens a pull request — directing the AI agents you already run.
  • Observe — it quantifies the work each fix removed; run it on a schedule and it catches the next regression before it compounds across thousands of builds.
The Build Caching Optimizer's phased run plan, Prerequisites through Report & PR, showing the identify, fix, observe loop as a live task list.

Root-cause every miss from the two builds that expose it

  • The agent runs paired cacheability experiments, then compares them through the Develocity MCP server to see exactly which input changed — a volatile timestamp, an absolute path, an overlapping output.
  • An encoded Gradle and Maven build-engineering playbook tells the agent where to look and how to read what it finds — without it, the same data access yields an exploratory, untargeted investigation.
  • Every fix is re-validated against a fresh build before it ships; a fix that doesn't raise the cache hit rate is discarded, not proposed.
The Build Caching Optimizer diagnosing Javadoc cache misses into root causes via the Develocity MCP server's build comparison.

We measured the difference Develocity makes — head-to-head against commodity AI

  • We benchmarked the agent head-to-head against commodity AI — representative caching scenarios from real open-source projects, the same frontier model on both sides.
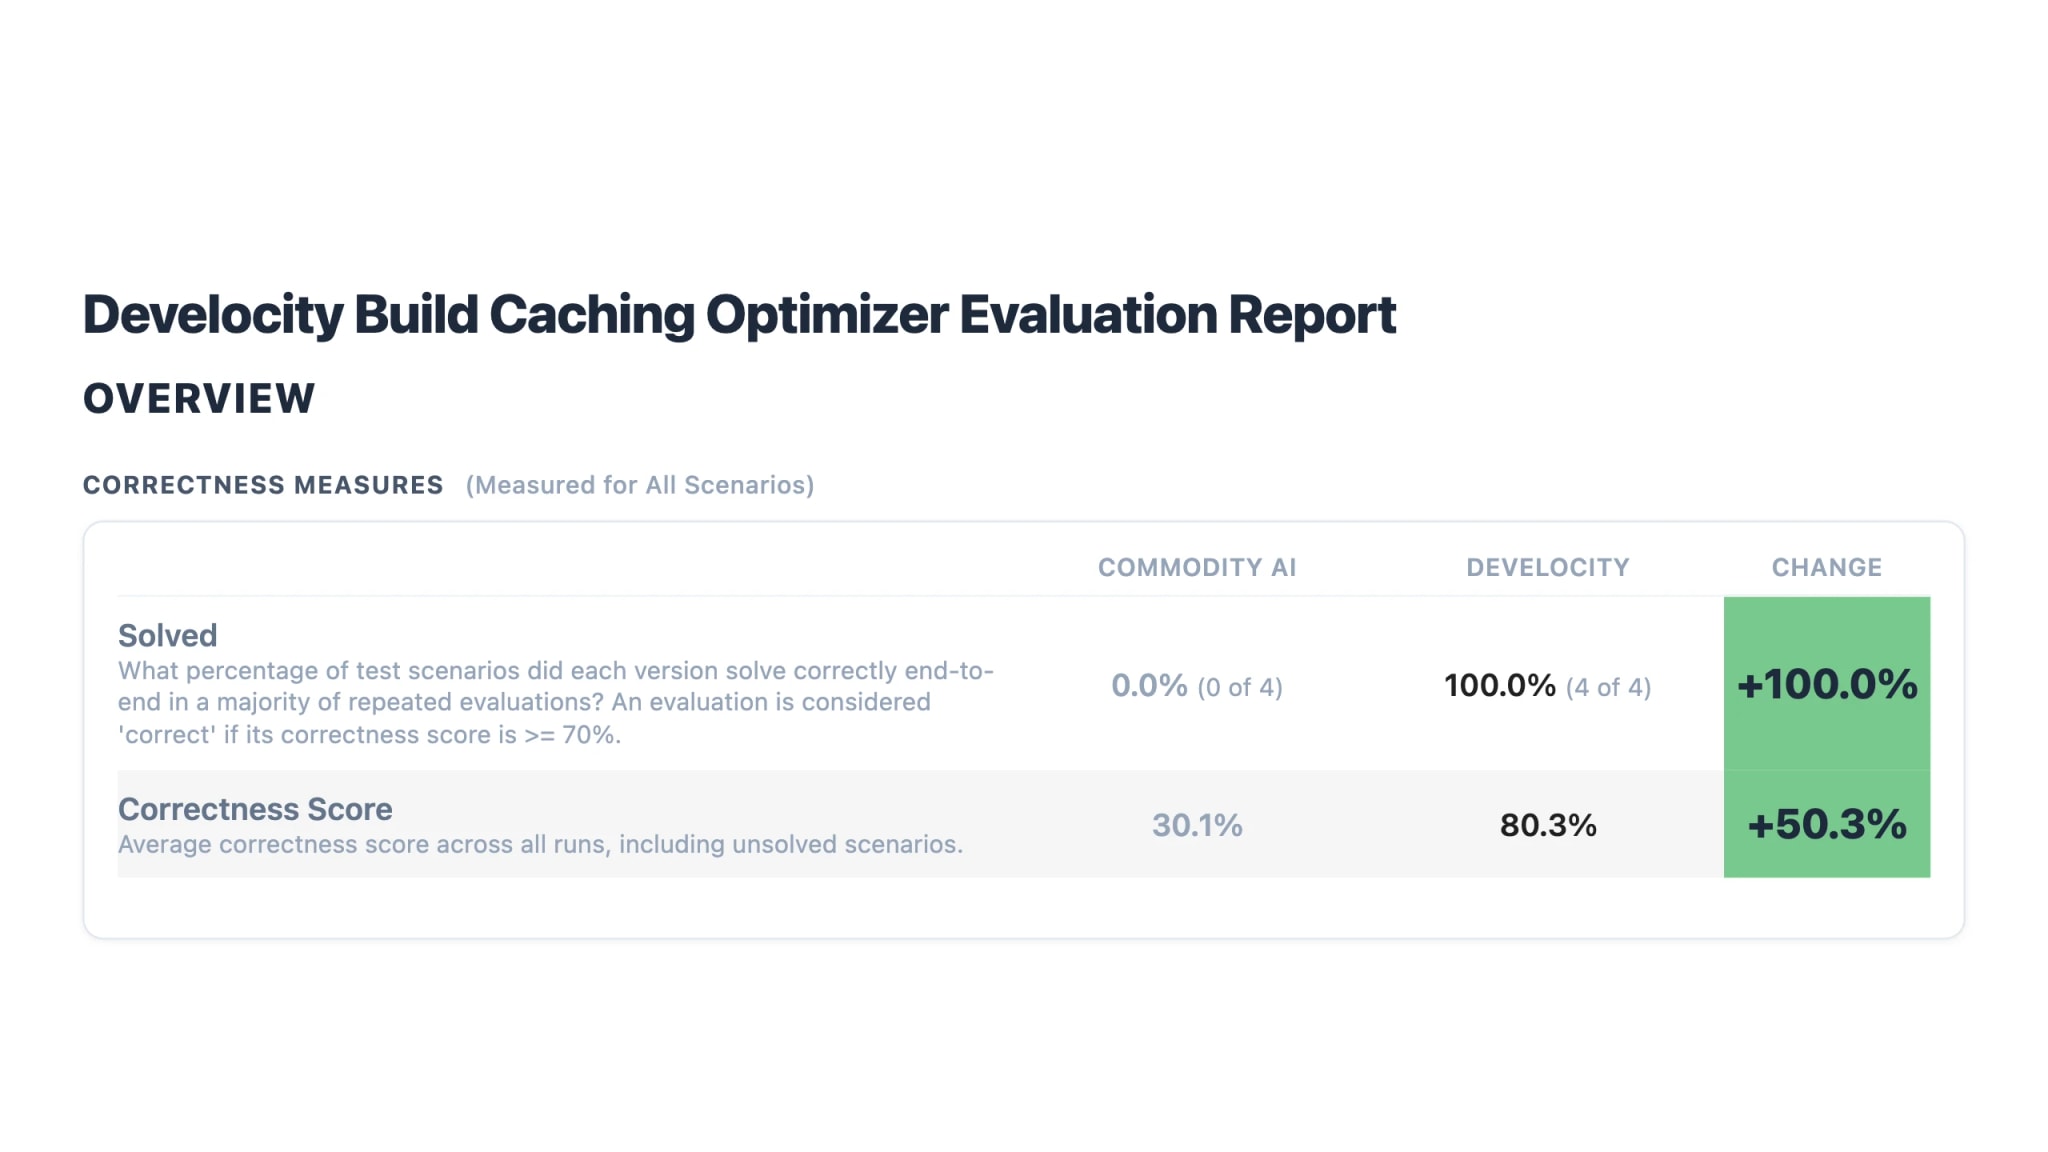
  • The only variable is what Develocity adds: from build logs alone, commodity AI solved 0 of 4 scenarios; grounded in Build Scan data and the encoded playbook, the agent solved 4 of 4 — correctness 30% → 80%.
  • Not a cost gap but a capability gap — without the build context, commodity AI burned through its token budget and still had no answer. Success rate is what counts: a fix is bought once, every future build inherits it.
  • The bar for solved: at least 70% judged correctness in a majority of a scenario's 10 runs.
The Build Caching Optimizer evaluation report's correctness table — commodity AI solved 0 of 4 scenarios versus Develocity's 4 of 4, average correctness rising from 30.1% to 80.3%.
Observability

Every run traceable in the Build Scans your builds already emit

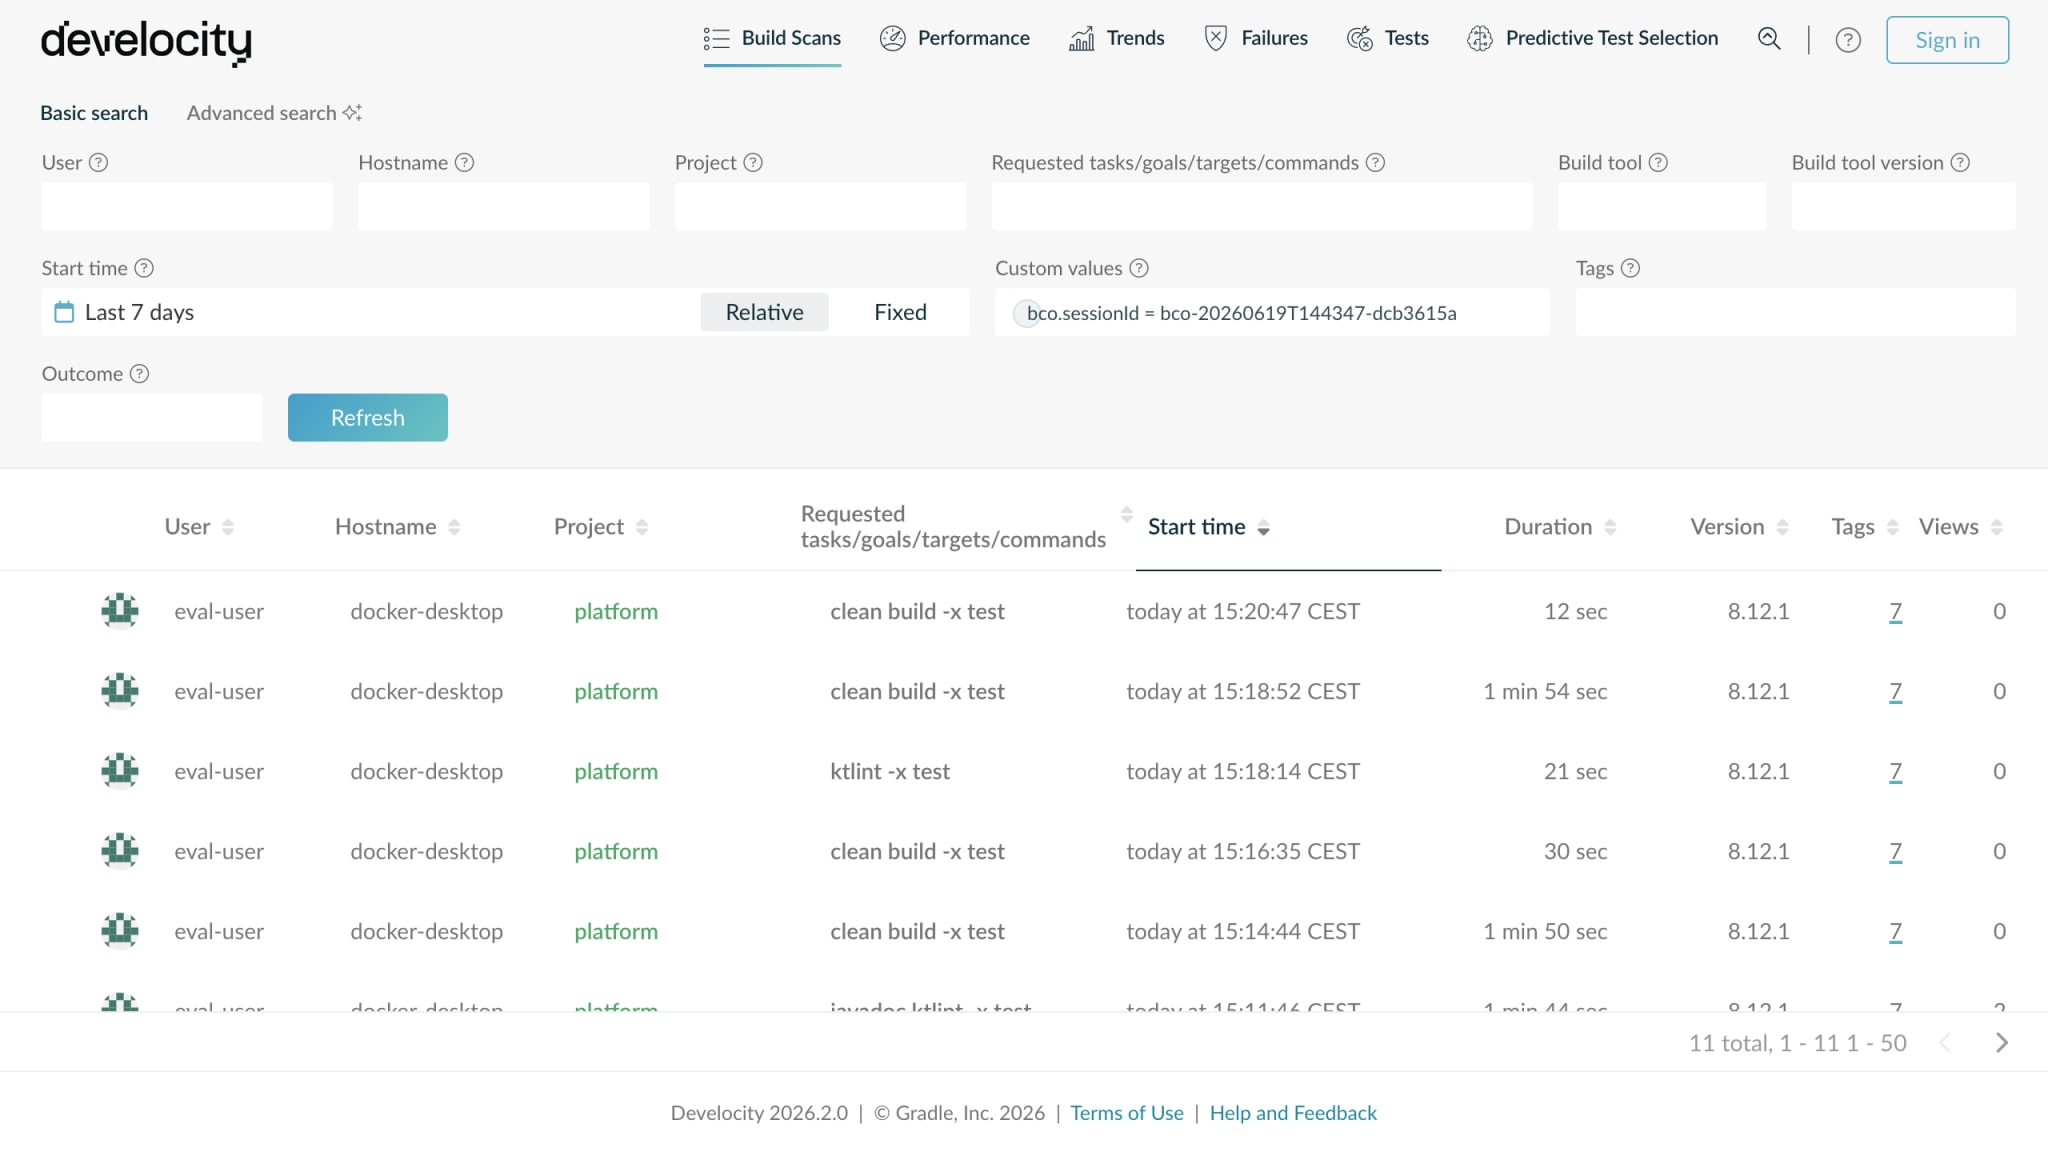
  • Every build the agent triggers — probe, experiments, validation — is tagged with a per-run session id (bco.sessionId) in the Build Scan it produces, so the whole run is recoverable from Develocity without the agent session.
  • Filter the Build Scans by that session id to see which builds a run produced and what each one proved — the evidence behind every finding, in the record your builds already emit.
  • The fix lands as a pull request, reviewed and merged the way every other change is, so a human approves each autonomous action before it ships.
A Develocity Build Scans list filtered by one run's session id, showing every build a single Build Caching Optimizer run produced, each attributed to the agent.
Analytics

Run it where it pays — the worst cache offenders across your organization

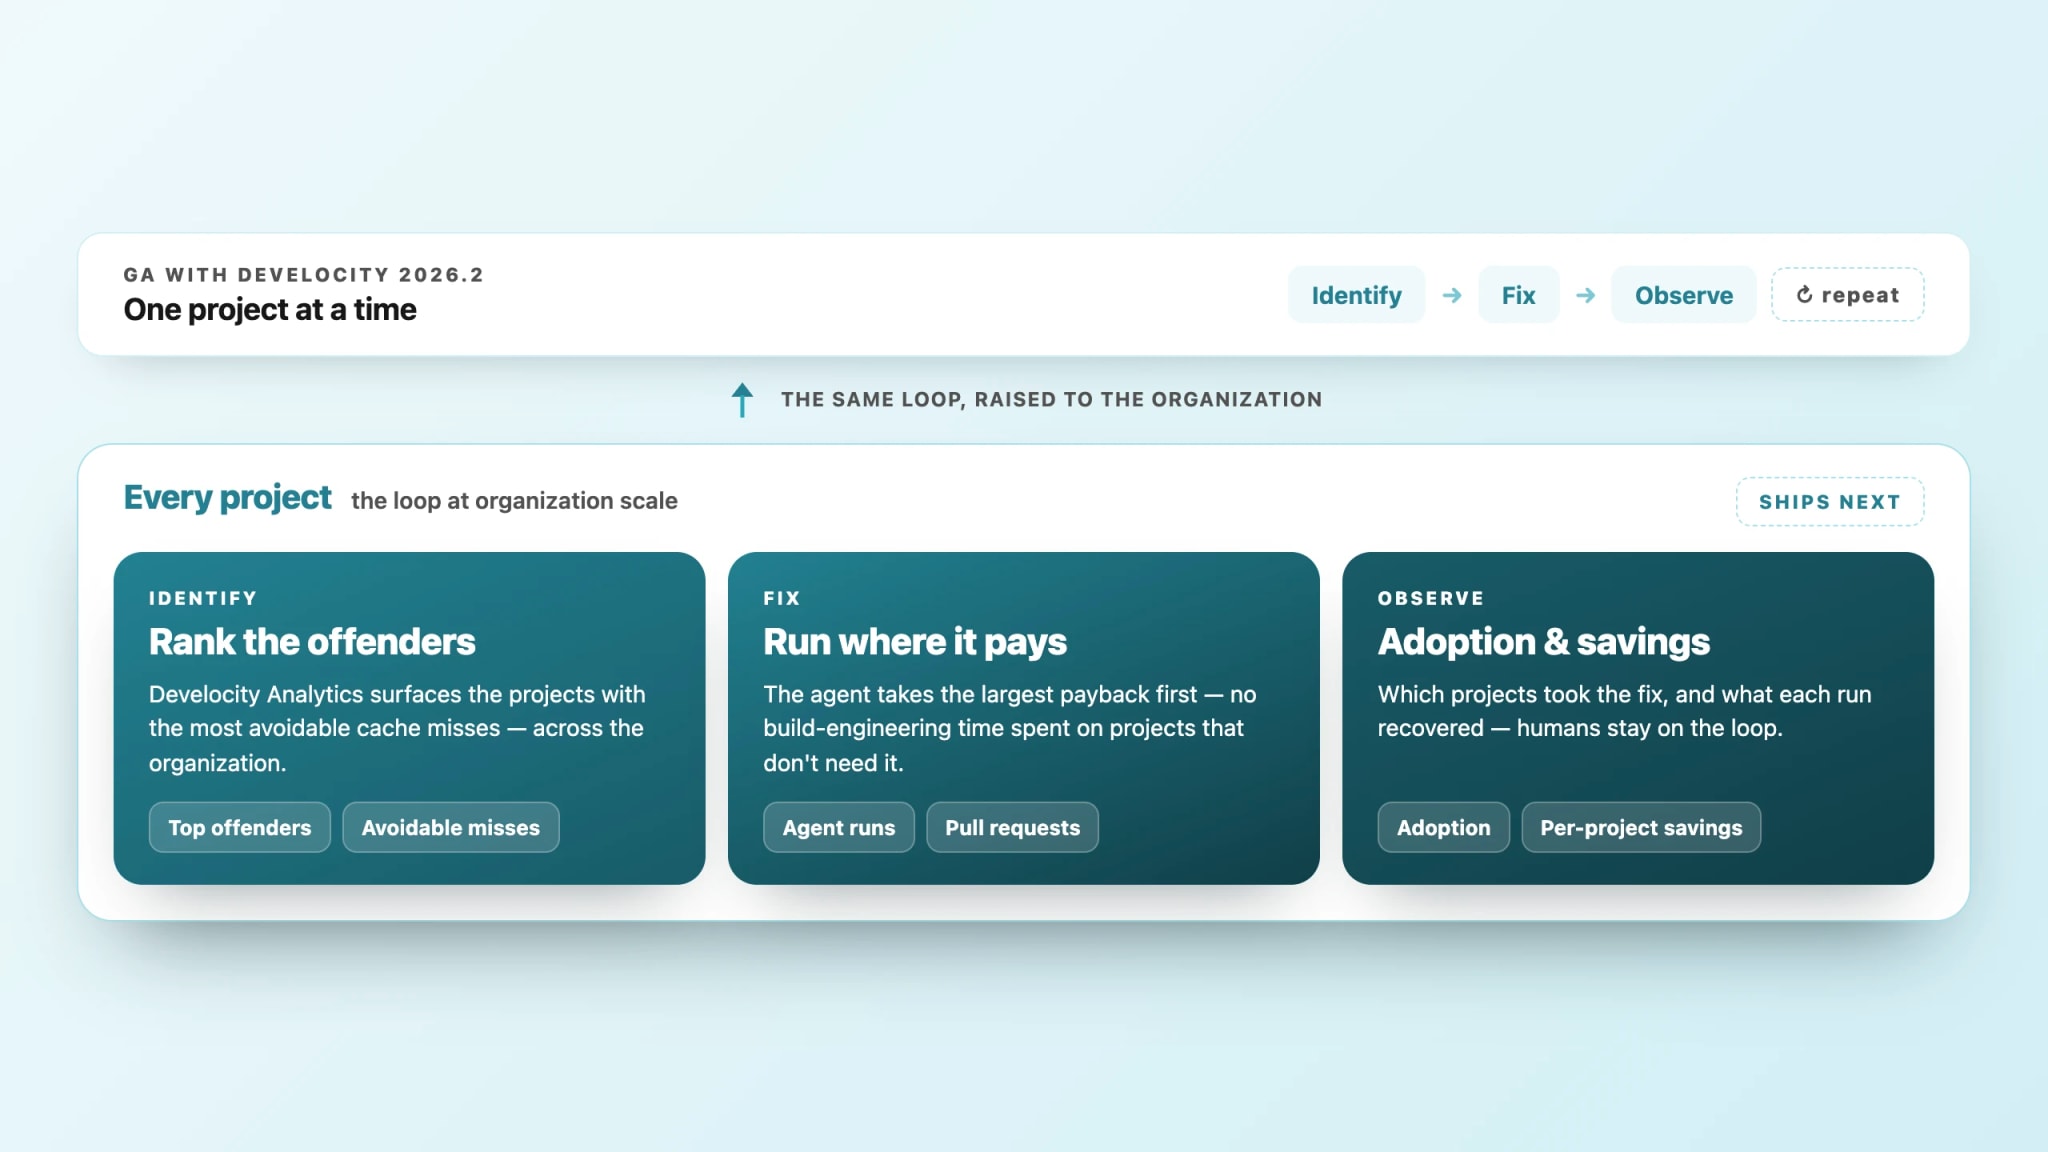
  • RoadmapA heuristic over Develocity Analytics ranks the projects across your organization with the most avoidable cache misses, so a platform team runs the agent where the payback is largest first.
  • RoadmapAn adoption view shows which projects have taken the fix and which haven't — the lever a platform team needs when it can fund optimization across the organization but can't mandate it team by team.
  • RoadmapPer-project savings quantify what each run recovered, so the payback of every funded optimization is a number, not an estimate.
A diagram raising the identify, fix, observe loop from one project to the whole organization — rank the top offenders by avoidable cache misses, run the agent where the payback is largest, and track adoption and per-project savings.

Resources

How DuckDuckGo cut their Android build times by up to 57%
Blog
Develocity saves Netflix 280,000+ hours per year with faster builds and tests
Case study
When AI code overloads CI, Universal Cache keeps builds fast and costs in control
Blog

What's next

Get started today with a 30-day free trial of the entire Develocity product suite.

Start Free Trial

© 2026 Gradle, Inc. Gradle®, Develocity®, Build Scan®, and the Gradlephant logo are registered trademarks of Gradle, Inc.

Get an AI summary of Develocity: