Gradle Technologies is now Develocity — read the announcement

Failure Handler

Get builds back to green, and stop spending tokens on failure investigations that never needed to run.

A coding-agent session in which the Failure Handler triages a test failure against cross-build data, finds it systemic across every branch, names the expired test certificate behind it, fixes it once at the source, and verifies the fix before opening a pull request.

Feature overview

Failure Handler

Failure Handler is the green-builds agent in Develocity Agents. In a large organization, a single systemic failure — one root cause breaking builds across projects and branches — is investigated separately by every developer and AI agent it hits. Failure Handler investigates it once. Its Failure Report ranks recurring failures by affected builds and flaky tests by wasted CI time across every project, with a paste-ready fix prompt for each. For any single failure, the handler checks cross-build Build Scan® data to determine whether it is flaky, pre-existing, or caused by your change. It then opens a pull request for a code-fixable cause, routes an operational cause to the owning team, or records the diagnosis so other agents skip re-investigating it. It runs inside the AI agents you already use, such as Claude and Codex, for Gradle and Maven builds.

Investigate a systemic failure once, fix it at the source, and stop paying for it in every build

  • Identify — the Failure Report ranks recurring failures by affected builds and flaky tests by recoverable CI time across every project, with a paste-ready fix prompt per row.
  • Fix — the handler diagnoses the root cause, then opens a pull request if code-fixable, routes operational causes to the owning team, or records the diagnosis.
  • Observe — re-run the report to verify that resolved failures drop off the ranking and see which remaining issues cost the most builds.
View documentation (opens in new tab)
The Failure Report ranking recurring failures by the builds they affect, the top failure hitting 56 builds a week, each row with a Copy prompt button.

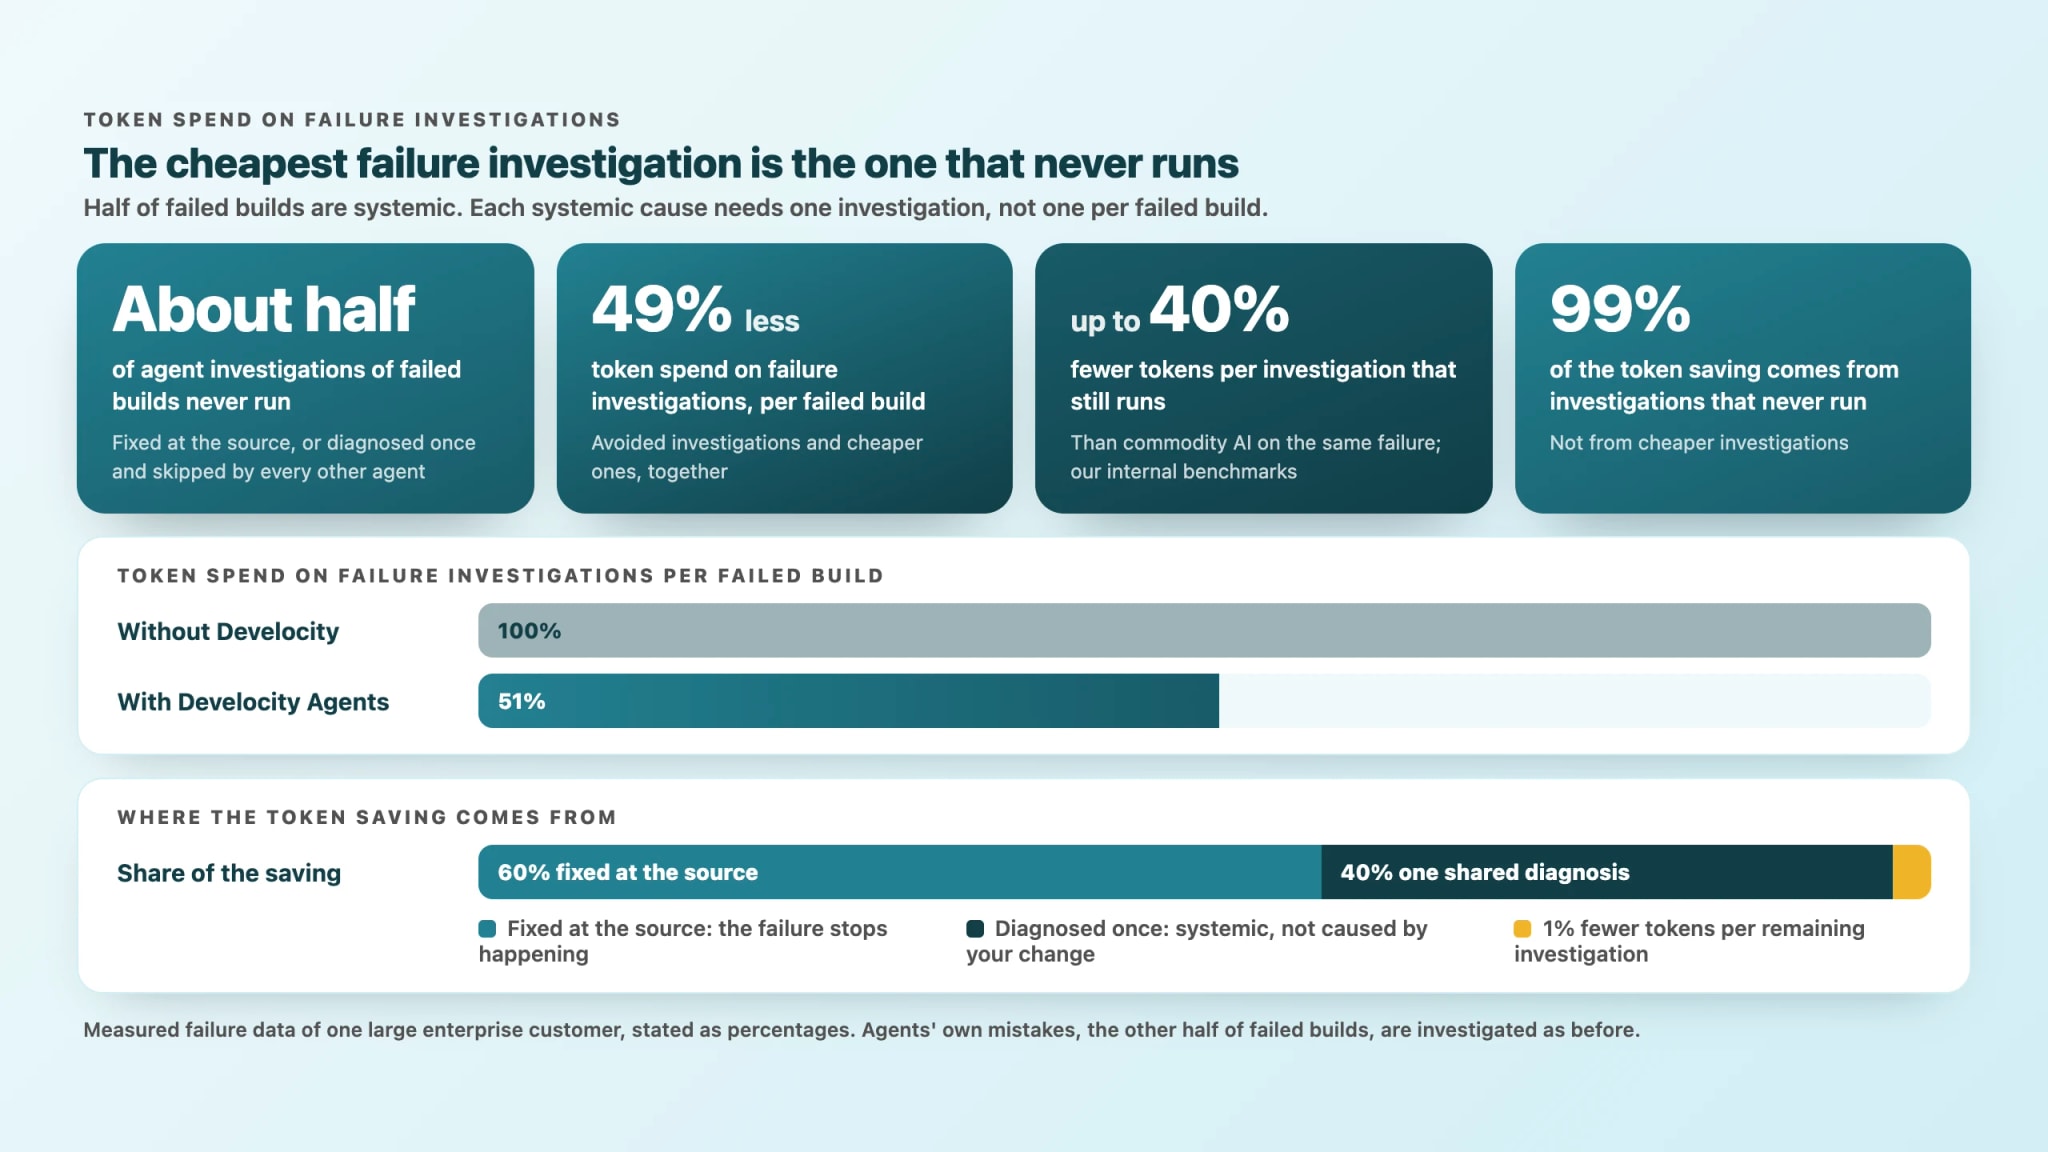
The cheapest failure investigation is the one that never runs

  • Half of failed builds are systemic at a large enterprise customer we measured: one shared cause breaks builds across branches, yet every agent hitting it investigates from scratch.
  • Each systemic cause needs one investigation — once fixed at the source or diagnosed, other agents see the failure is systemic, not caused by their change, and skip investigating.
  • About half of all agent investigations of failed builds never run on that customer's data, cutting token spend on failure investigations by 49% per failed build.
  • Up to 40% fewer tokens than commodity AI for the one investigation that still runs per systemic cause, our internal benchmarks show.
For one large enterprise customer, half of the failed builds are systemic and each systemic cause needs one investigation. About half of all agent investigations of failed builds never run, each systemic cause is investigated once with up to 40% fewer tokens than commodity AI, and token spend on failure investigations falls 49% per failed build. 99% of the token saving comes from investigations that never run.

Tackle top recurring failures centrally, or check a broken build mid-task

  • Preventive — the central platform team runs the Failure Report across every project and works down the ranking by impact, starting where the organization loses the most.
  • Acute — when a failed build blocks a developer or coding agent mid-task, the handler checks cross-build data to answer is this failure mine? so pre-existing failures aren't re-investigated.
  • Paste a fix prompt from the report, or ask the handler to fix a failure directly, and it resolves the issue whether systemic or caused by your change.
A coding-agent session answering whether a failed build is the developer's fault — the verdict pre-existing, with Build Scan evidence and a reproduction recipe, and no change made.

Diagnose against every build in the organization before acting on one

  • Triage queries cross-build data to match the failure signature and determine its spread — a one-off, confined to one branch, or failing across every branch.
  • Every failure is classified as code-fixable or operational, and local or systemic, so the handler addresses the root cause instead of patching a local symptom.
  • For flaky tests, the handler grades diagnosis confidence and calculates how many test runs are needed to reproduce and verify the fix from the observed flake rate.
  • Every fix is verified by reproducing the failure before the change and confirming it passes after — without suppressing the test or touching code outside the failure's blast radius.
View documentation (opens in new tab)
A structured diagnosis card — recurrence across 12 builds, classification code-fixable and local, cited root cause, reproduction recipe, and the fix verified as reproduced before and gone after.

What one run uncovered on the public Apache open-source instance

  • Across 214 weekly build failures on the public Apache instance, the Failure Report isolated seven high-impact recurring causes — the top one breaking 56 builds a week.
  • The flaky-test report ranked 39 flaky test classes across three projects wasting 4.9 CI hours a week — cost that build-failure rankings miss because passing retries turn builds green.
  • In that same week, failed builds consumed 288 of the instance's 6,184 CI hours — compute wasted on broken runs and reruns that fixing root causes reclaims.
The Failure Report ranking flaky test classes by the CI time they waste, 4.9 hours a week in total, the top test costing 1.6 hours a week.
Analytics

Prioritize fixes from the failure groups and test history Develocity already captures

  • The Failure Report reads Cross-Build Failure Grouping from Failure Analytics through Develocity Analytics, ranking recurring failures across every project without a project-by-project hunt.
  • Flaky tests are ranked at the test-class level by recoverable CI time using Test Analytics, pinpointing which classes waste the most compute on retries.
  • Git branch tags and recency weight the ranking — failures on integration branches rank above single-branch or local failures, and dormant issues drop down automatically.
  • Runs in AI agents such as Claude and Codex on Gradle and Maven builds, using Develocity 2026.3, the MCP server, and Build Scans with Git branch tags.
Failure Classification Guide (opens in new tab)
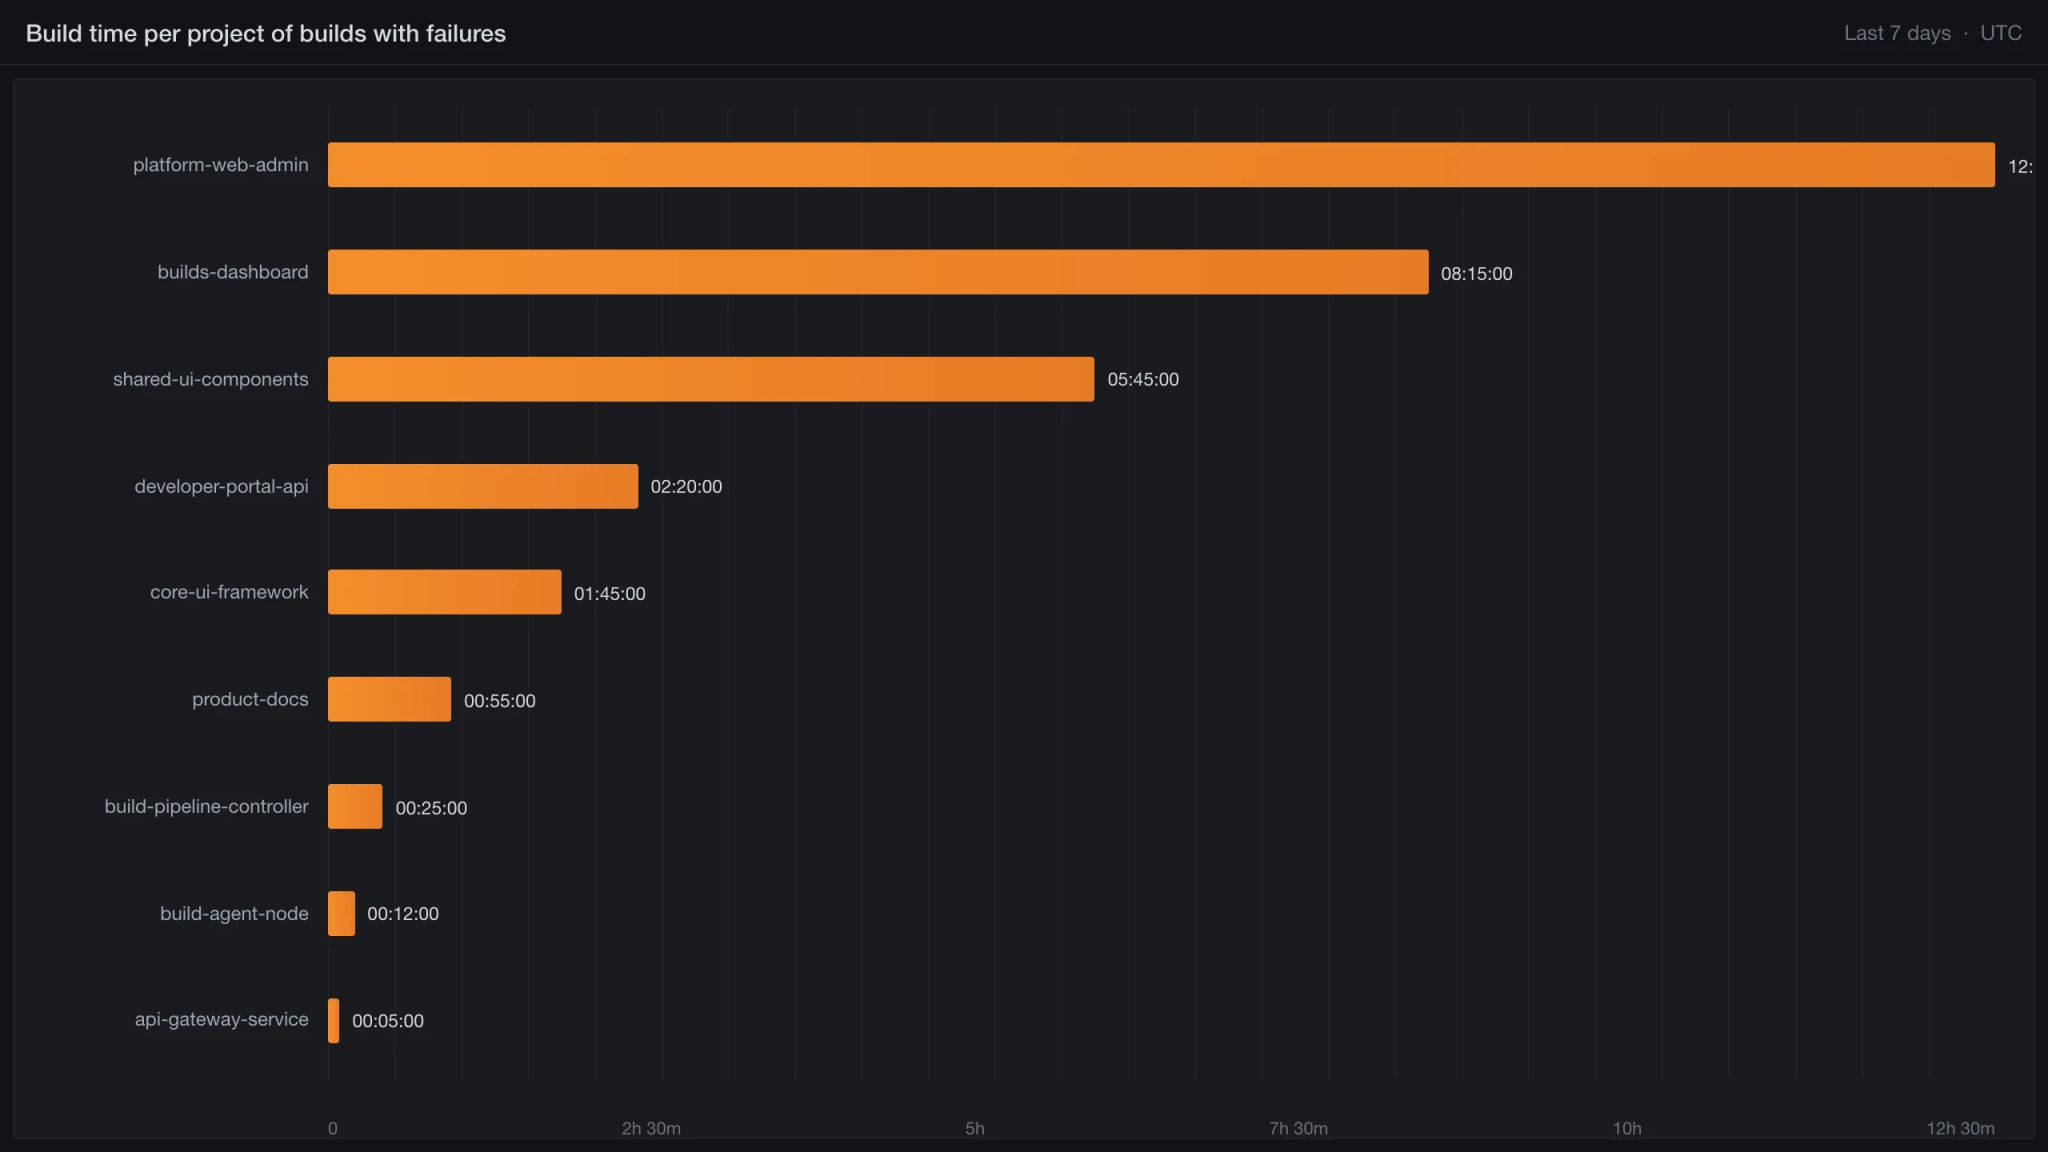
Develocity Analytics Build Failures view showing projects ranked by cumulative failed CI build time.

Resources

The Phantom Executor: Debugging Develocity with Develocity
Blog
Your Developers Are Still Paying for Your Toolchain
Blog
Develocity 2026.3 release notes
Blog
Flaky Tests: The Productive Developer's Guide (whitepaper)
Whitepaper

What's next

Get started today with a 30-day free trial of the entire Develocity® product suite.

Start Free Trial

© 2026 Gradle, Inc. Gradle®, Develocity®, Build Scan®, and the Gradlephant logo are registered trademarks of Gradle, Inc.

Get an AI summary of Develocity: